


Most teams now collect some telemetry from their agents. In LangChain’s State of Agent Engineering survey of 1,340 practitioners, run from November 18 to December 2, 2025, 89% reported some form of observability, yet only 52.4% ran offline evaluations and 37.3% ran online evaluations [1]. Quality was the most cited barrier to putting agents into production [1].
That gap is what AI agent observability is meant to close. A final answer rarely explains why an agent succeeded or failed. The path behind it can include model calls, retrieved context, tool calls, retries, approvals and handoffs. Observability makes that path inspectable, so you can diagnose latency, cost, quality and policy problems without turning your trace store into a privacy liability.
This guide defines the signals to capture, shows how traces differ from dashboards and evaluations, and gives you a practical way to compare observability platforms.
Key takeaways
- AI agent observability records the full path of a run (plan, model calls, retrieval, tool calls, retries and human approvals) as a trace you can inspect, not just the final answer.
- Track a small metric set per workflow: technical signals such as latency, tokens, cost and tool errors, plus outcome signals such as task completion, evaluation scores and escalations.
- OpenTelemetry’s GenAI conventions for agent spans are still at Development status, so pin the version you emit and recheck attribute names when you implement [3].
- Treat traces as sensitive production data: capture prompts and outputs only when needed, redact at the collector and set retention by data class.
- Compare tools with a proof of concept on the same tasks and failure cases, not with feature pages.
What is AI agent observability?
AI agent observability is the practice of reconstructing what an agent did, step by step, and linking each step to its latency, cost and outcome. Langfuse describes it as capturing every step an agent takes as structured traces that can be inspected, filtered and evaluated [5]. The vendor also makes the practical case: in multi-step systems, failures usually hide in an intermediate step rather than in the final answer [5].
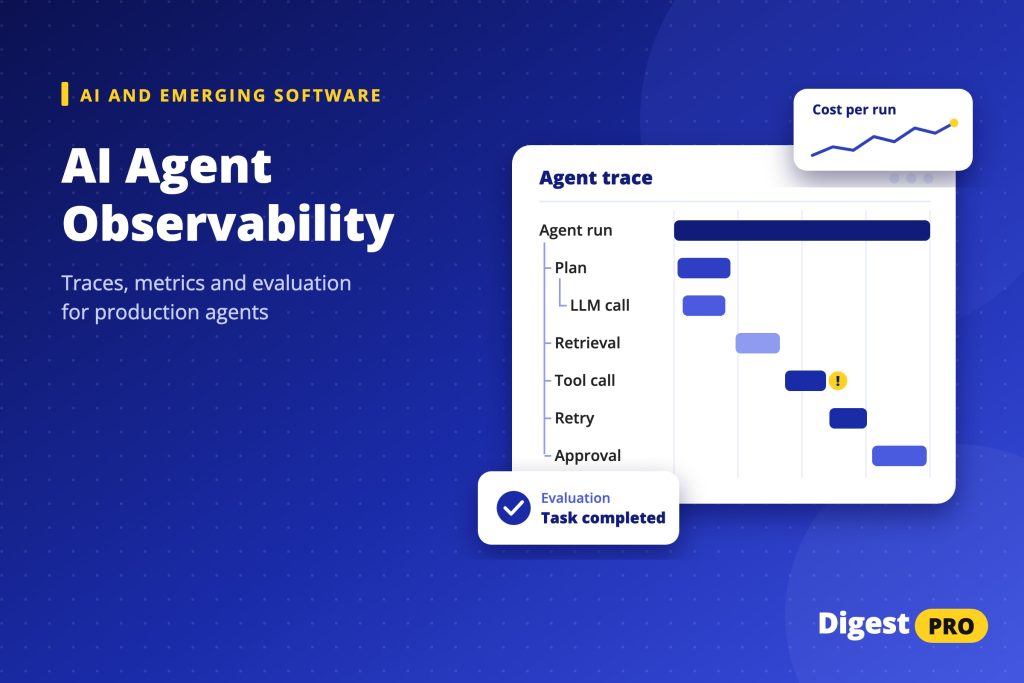
The core unit is the trace. A trace is the request-level path of one agent run. Inside it, spans record each operation: the model call that planned the task, the retrieval step, each tool call, any retry and any human handoff or approval. Parent-child links between spans show which step triggered which.
That makes observability different from three neighbors:
- Logs record events but rarely connect them into one causal path.
- APM measures services and endpoints. It does not know that a model chose a tool call, or why.
- Offline evaluation tests the agent against a fixed dataset before release. Observability watches real traffic after release.
It also differs from orchestration. AI agents orchestration decides which agent or tool runs next. Observability records what actually ran, so you can check whether the orchestration logic behaved as designed.
The signals teams should collect
Collect signals in two groups. Technical signals tell you whether the run worked. Outcome and policy signals tell you whether it did the job safely.
Technical signals
- Trace structure: every plan, model, retrieval and tool step, with parent-child links.
- Latency per step and per run. OpenTelemetry’s draft GenAI metrics include agent invocation duration, tool execution duration and counts of model and tool calls per agent run [4].
- Tokens and cost per run, per user and per model. Agents decide how many calls to make, so cost per run varies more than cost per request.
- Tool success and errors, including timeouts, invalid arguments and empty results.
- Retries and loops, which often reveal a tool or planning failure that a plausible final answer hides.
Outcome and policy signals
- Task completion: did the run reach the goal the workflow defines?
- Evaluation scores from code checks, model-based graders or human review.
- Escalations and session resolution. LangChain groups related traces into threads so you can judge a multi-turn conversation, not just one request, according to the vendor [6].
- Policy and approval events: guardrail blocks, approvals granted or denied, and actions taken under elevated permissions.
Do not chase one universal agent score. Define 4 to 6 metrics per workflow, give each an owner and decide in advance what a breach triggers.
| Signal | Why it matters | Owner | Response when it breaches |
|---|---|---|---|
| p95 run latency | Slow runs lose users and often hide loops | Platform or SRE | Inspect the slowest traces, cap iterations |
| Cost per completed task | Agents choose their own number of calls | Product owner | Review prompt size, model routing, retry policy |
| Tool error rate | Broken tools trigger silent workarounds | Tool or service owner | Fix the integration, validate inputs |
| Task completion rate | The outcome the business pays for | Product owner | Sample failed traces, add evaluation cases |
| Evaluation score | Catches quality drift before users report it | AI quality lead | Compare with last release, roll back if regressed |
| Policy and approval events | Shows where agents reach risky actions | Security or risk | Review blocked actions, tighten tool permissions |
How to instrument an agent end to end
Instrument once, with a vendor-neutral event model, so you can change backends later. Whatever platform you choose, each span should carry these fields:
| Field | What to record |
|---|---|
| Run and session IDs | One trace ID per run, plus a conversation or session ID to group runs |
| Parent span ID | Links each step to the step that caused it |
| Operation type | Plan, model call, retrieval, tool call, handoff or approval |
| Model or tool, with version | Lets you compare releases and providers |
| Start and end timestamps | Latency per step and per run |
| Tokens and cost | Input and output tokens, priced per model |
| Outcome and error type | Success, failure class, retry count |
| Safe metadata | Tenant, workflow, prompt version; no secrets or raw personal data |
The open standard to watch is OpenTelemetry. Its GenAI semantic conventions now live in a dedicated repository and define agent spans for creating and invoking agents, invoking workflows, planning and executing tools, with attributes such as conversation ID and token usage [3]. Those agent conventions carry Development status, and the repository was still being updated in late October 2026 [3]. Check the current version when you implement and record which version you emit.
The OpenTelemetry project describes two instrumentation routes: telemetry built into the agent framework, or external instrumentation libraries [2]. Built-in telemetry is simpler to adopt. External libraries decouple observability from the framework but risk fragmentation. The project asks framework authors to let users switch built-in telemetry off, to avoid duplicate spans [2].
Correlation is the hard part. Propagate trace context from the orchestrator into every tool and downstream service, so a slow database query or failed API call appears inside the agent trace. If you are still designing the agent, add this during the build; our guide on how to build AI agents covers that stage. If you run self-hosted AI agents, decide early whether traces stay in your environment or go to a SaaS backend.
Evaluation, alerts and incident review
Traces tell you what happened. Evaluations tell you whether it was good. You need both, at different moments.
Offline and online evaluation
Offline evaluation runs the agent against a fixed dataset before each release. Online evaluation scores live traffic with reference-free checks and user feedback [5]. Anthropic’s engineering team separates capability evals, which start with low pass rates, from regression evals, which should stay near 100% and catch backsliding [7]. It adds that production monitoring detects distribution drift and real-world failures that pre-launch evals miss [7].
Use three grader types where each fits: code checks for deterministic rules, model-based graders for open-ended quality, and sampled human review to calibrate both [7]. In LangChain’s survey, 59.8% of respondents used human review and 53.3% used LLM-as-judge [1].
Alerts
Alert on rates and percentiles, not single failures: p95 latency, cost per completed task, tool error rate, evaluation score drops and spikes in policy blocks. Set thresholds per workflow from a baseline period, then tighten them.
The post-incident loop
- Inspect the trace and find the first step that went wrong.
- Classify the failure: model, retrieval, tool, planning, policy or data.
- Add the case to your evaluation set. Anthropic recommends turning user-reported failures into test cases so the suite reflects real usage [7].
- Update the prompt, tool, guardrail or permission that caused it.
- Rerun the regression suite and confirm the fix broke nothing else.
Privacy, security and governance for agent traces
Agent traces can contain everything a user typed, everything a tool returned and the instructions you gave the model. Treat the trace store as sensitive production data, not a debug folder.
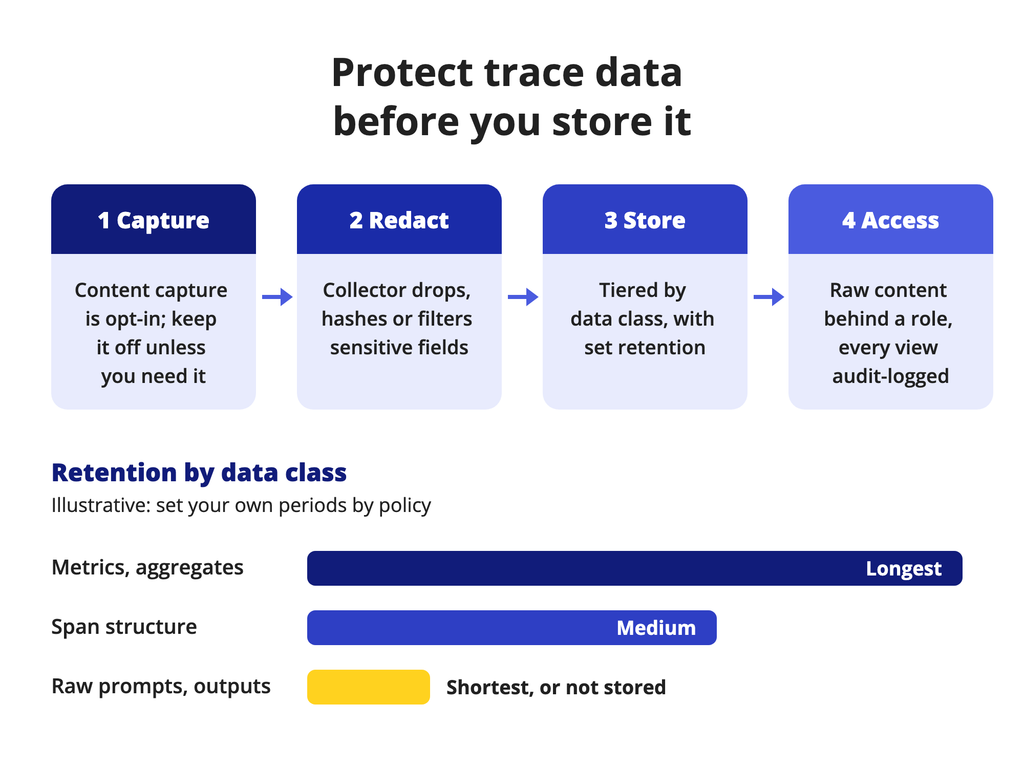
Start with minimization. OpenTelemetry’s guidance on sensitive data tells implementers to collect only data that serves an observability purpose and makes them responsible for complying with privacy laws [8]. Its GenAI conventions mark message content, system instructions and tool definitions as opt-in and warn that inputs and outputs are likely to contain personal data [3].
Then apply four controls:
- Redact before storage. Use collector processors to drop, hash or filter attributes and spans that carry sensitive data [8]. Hashing may not anonymize small, predictable values [8].
- Restrict access. Give engineers structure and metrics by default, and gate raw content behind a role and an audit log.
- Set retention by data class. Keep metrics longest, full-content traces shortest, and document why.
- Log decisions, not payloads. Record which policy blocked an action and who approved an override, without copying patient, customer or credential data.
Map this to your governance framework. The NIST AI Risk Management Framework calls for monitoring AI system behavior in production and for post-deployment monitoring plans [9]. Observability produces that evidence. Logging alone does not make an agent safe or compliant; it gives you the record to show what happened and to fix it.
How to compare AI agent observability tools
There is no single best tool. The right platform depends on your framework, hosting model, data sensitivity and how much evaluation you need built in. Score candidates on criteria you can test:
| Criterion | What to test in a proof of concept |
|---|---|
| Trace depth | Are plans, tool calls, retrieval, retries and handoffs separate, linked spans? |
| Framework coverage | Does it instrument your framework and model providers without custom code? |
| OpenTelemetry support | Can it ingest and export OTLP, and which GenAI convention version does it follow? |
| Evaluation | Online and offline evals, human annotation, datasets built from production traces |
| Redaction and access | Field-level masking, role-based access to raw content, audit logs |
| Retention and residency | Retention per data class, self-hosted or regional options |
| Export | Can you get raw traces out in bulk if you switch? |
| Cost model | Price per trace, span, seat or volume, modeled on your projected runs |
Run the proof of concept on the same representative task for every candidate. Include known failure cases: a broken tool, a looping plan, an input that should be blocked and a run that needs human approval. Check how quickly each tool surfaces the failing step, whether it redacts the fields you flagged and what it would cost at your projected volume.
Treat feature pages as vendor claims until your test confirms them. Vendor benchmarks and customer stories are not independent evidence.
Summary
AI agent observability turns each agent run into a trace you can inspect, measure and evaluate. Collect technical and outcome signals per workflow, instrument with a vendor-neutral event model, feed every incident back into your evaluation set and protect trace data like any other sensitive production store.
Before a production pilot, set a minimum baseline: end-to-end traces with run and session IDs, latency and cost per run, tool error rates, an offline regression set built from known failures, sampled human review, redaction at the collector and a written retention policy. Add online evaluation and alerting as traffic grows.
FAQs
What is observability for AI agents?
Observability for AI agents is the ability to reconstruct each run as an end-to-end trace: the plan, model calls, retrieval, tool calls, retries and human steps, with latency, cost and outcome attached to each. It lets you find the step that caused a failure, track quality over time and show what an agent did when someone asks.
What is the best tool for AI observability?
There is no universal winner. The right tool depends on your agent framework, whether traces must stay in your environment, how sensitive the data is and how much evaluation you need. Shortlist tools that support OpenTelemetry, redaction, role-based access and bulk export, then run the same proof of concept with known failure cases before you decide.
How is agent observability different from LLM monitoring?
LLM monitoring usually tracks single model calls: prompts, responses, tokens, latency and errors. Agent observability adds the workflow around those calls: which tool the agent chose, retries and loops, handoffs between agents, human approvals and whether the overall task succeeded. It evaluates sessions and outcomes, not only individual responses, and links each failure to a specific step.
References
- State of Agent Engineering. LangChain, public survey fielded 18 Nov to 2 Dec 2025 (1,340 responses). Accessed 28 Oct 2026.
- AI Agent Observability: Evolving Standards and Best Practices. OpenTelemetry blog (Guangya Liu, IBM; Sujay Solomon, Google), 6 Mar 2025. Accessed 28 Oct 2026.
- Semantic Conventions for GenAI agent and framework spans. OpenTelemetry, semantic-conventions-genai repository, status Development, living document. Accessed 28 Oct 2026.
- Semantic conventions for generative AI metrics. OpenTelemetry, semantic-conventions-genai repository, status Development, living document. Accessed 28 Oct 2026.
- AI Agent Observability, Tracing & Evaluation with Langfuse. Langfuse (vendor), 16 Mar 2025, with later updates. Accessed 28 Oct 2026.
- AI Agent Observability: Tracing, Testing, and Improving Agents. LangChain (vendor), 7 Apr 2026. Accessed 28 Oct 2026.
- Demystifying evals for AI agents. Anthropic Engineering, 9 Jan 2026. Accessed 28 Oct 2026.
- Handling sensitive data. OpenTelemetry documentation, undated living page. Accessed 28 Oct 2026.
- AI RMF Core. NIST AI Resource Center, excerpt of AI RMF 1.0 (Jan 2023). Accessed 28 Oct 2026.