By September 2024, the EU’s digital maturity assessment tool had collected almost 9,000 assessments of SMEs and public sector organizations, and the average SME scored 40 out of 100, according to the European Commission’s Joint Research Centre [1]. That number is useful inside its own method. Outside it, the number means very little.
A digital transformation maturity assessment helps leaders discuss capability gaps and sequence investment. A score is only as useful as its evidence and definitions, and organizations use different dimensions and scales, so there is no single universal model.
This guide offers a transparent, editorial scorecard. It explains how to collect evidence across business and technology, and how to turn findings into a prioritized roadmap rather than a league table.
Key takeaways
- Maturity describes current capability against a stated reference model. It is not proof of outcomes, and it is not readiness for a specific change.
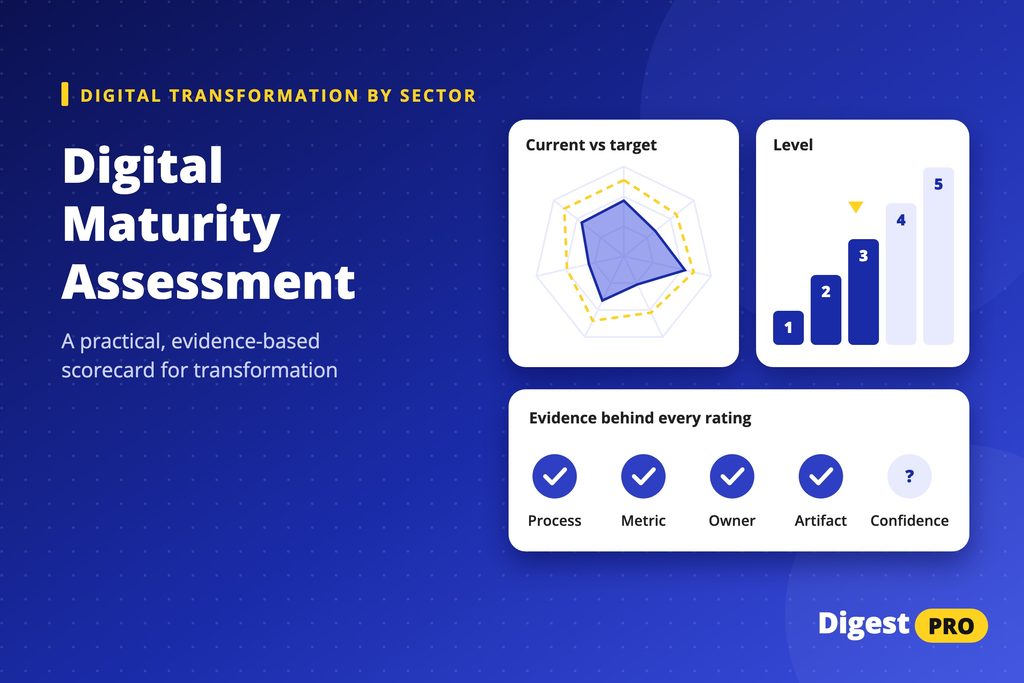
- Every rating needs evidence: an observed process, a metric, an owner, a system artifact and a confidence level.
- Use a five-level scale with “not assessed” as a valid answer. A forced score on thin evidence is worse than no score.
- Turn gaps into a short list of initiatives with owners and leading and lagging measures. Reassess only when you can evidence real change.
- The scorecard in this article is an editorial starting point, not an industry standard, benchmark, certification or predictor of financial performance.
What does a digital transformation maturity assessment measure?
A digital transformation maturity assessment rates how well your organization can do something today, repeatedly, against a reference model you state up front. It answers “how capable are we?”, not “how well did we perform?”
Keep three ideas apart. Maturity is current capability. Outcomes are results, such as revenue, cost or customer satisfaction. Readiness is your ability to absorb one specific change, such as a new platform, in the next few months. A team can be mature and still miss its targets, or ready for one change and immature overall.
Models differ because their authors care about different things. KPMG assesses eight capabilities of what it calls a connected enterprise, through a short survey that benchmarks results against its view of best practice [2]. The European Commission’s tool, built for SME self-assessment, uses six dimensions, from digital business strategy to green digitalization [3][4]. Prosci looks at people, process, technology and culture across five stages [5].
So a “level 3” in one model is not a level 3 in another. Do not compare scores across organizations unless they used the same questions, scale and evidence rules. For the wider context of where organizations are investing, see our overview of digital transformation trends. This article focuses on the assessment method itself.
Choose assessment dimensions and evidence
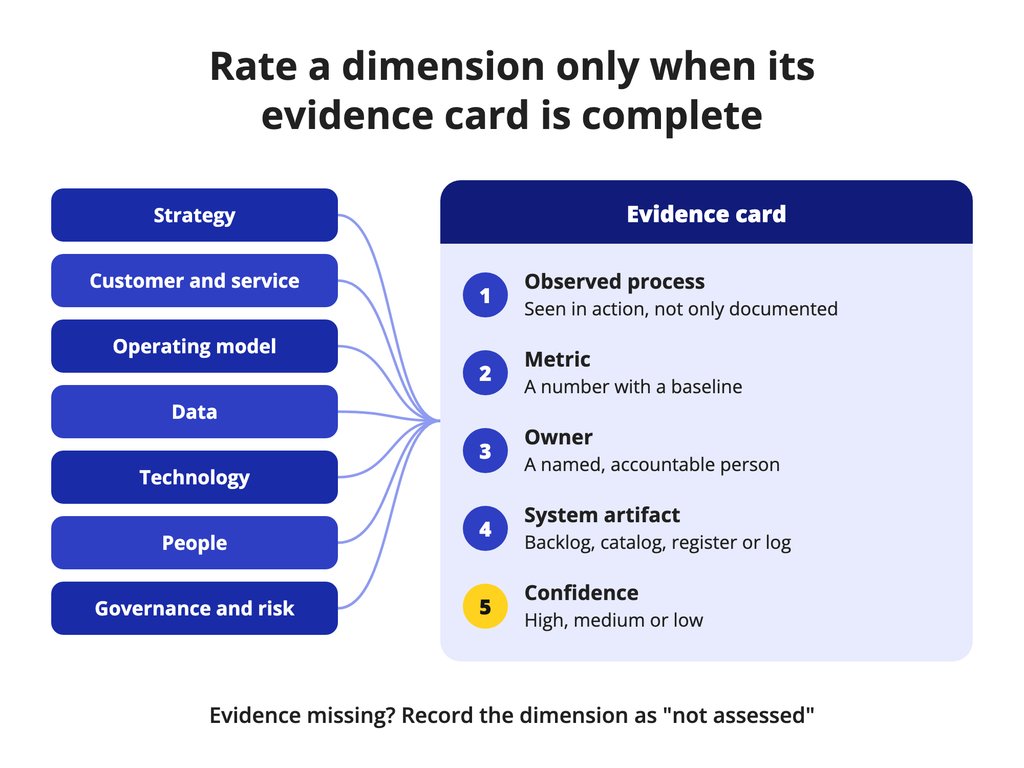
Pick dimensions that cover how value is created and delivered, not only technology. A practical set for most organizations:
- Strategy: whether digital goals are funded and tied to business goals.
- Customer and service: how journeys are designed, measured and improved.
- Operating model: team structures, decision rights and funding flows.
- Data: ownership, quality and reuse.
- Technology: architecture, platforms and the ability to change safely.
- People: skills, roles and capacity to learn.
- Governance and risk: how decisions, controls and risks are managed during change.
Adjust the list to your context, and write down why each dimension is in scope. A regulated bank may split governance and risk. A manufacturer may add an operations or product dimension.
The bigger decision is evidence. Self-rating alone produces optimistic scores. Prosci notes that self-assessment builds ownership but can miss blind spots, and suggests pairing it with an external view [5]. Require an evidence card for every rating with five prompts:
- Observed process: can you watch the practice happen, or only read about it?
- Metric: is there a number that shows the practice works, with a baseline?
- Owner: does a named person answer for this capability?
- System artifact: is there a record in a system, such as a backlog, data catalog, risk register or deployment log?
- Confidence: high, medium or low, based on how much of the above you found.
Dimension scores also move at different speeds. In the EU tool’s data, AI and automation contributed the least to SME scores, with an average of 19 out of 100 [1]. Expect your newest capabilities to score lowest, and do not treat that as failure.
A practical five-level digital maturity scorecard
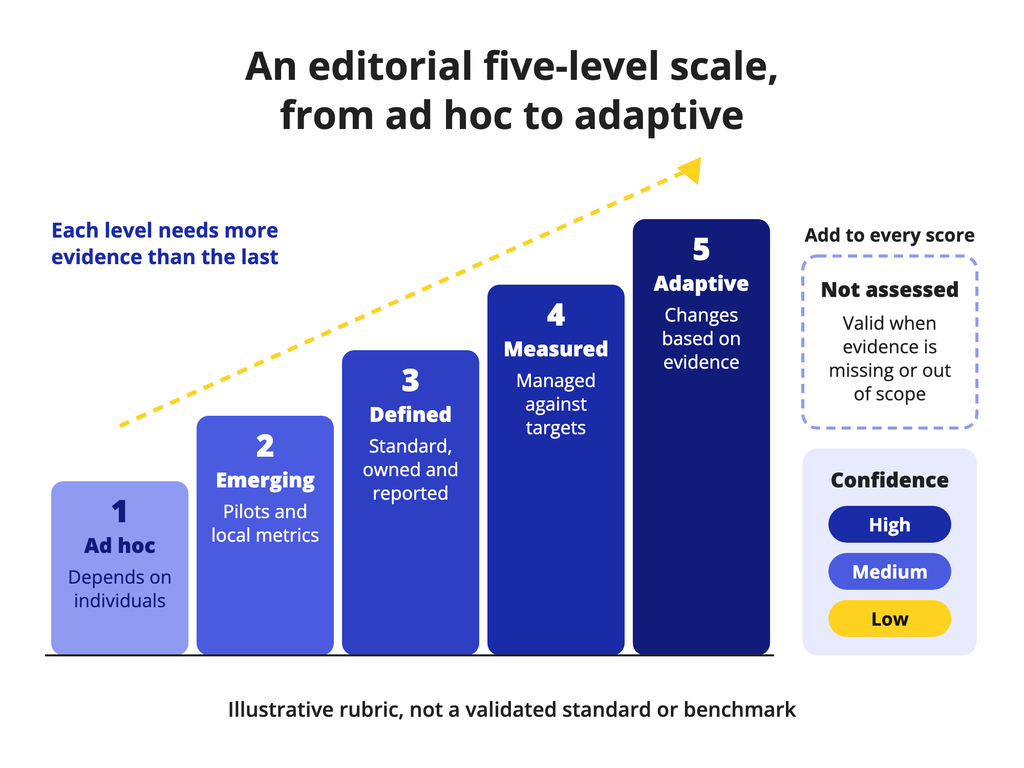
Use this editorial rubric as a starting point. It is not validated against performance data, so treat it as a structure for discussion and evidence, not a measurement standard.
- Level 1, Ad hoc: results depend on individuals. No owner, no metric, and the work is done differently each time.
- Level 2, Emerging: pilots or team-level practices exist. Some owners and local metrics, but nothing repeats across units.
- Level 3, Defined: a documented, organization-wide practice with a named owner and reported metrics.
- Level 4, Measured: the practice is managed against targets, and data drives decisions and exception handling.
- Level 5, Adaptive: the practice changes based on evidence, and funding or design shifts when results move.
Add two fields that most scorecards skip. “Not assessed” is a valid answer when evidence is missing or the dimension is out of scope. Confidence (high, medium, low) travels with every score, so a level 3 with low confidence reads as a question, not a fact.
| Dimension | Evidence to request | Level 1 looks like | Level 3 looks like | Level 5 looks like |
|---|---|---|---|---|
| Strategy | Approved roadmap, funding decisions | Digital goals live in slides, not budgets | Funded roadmap tied to business goals | Portfolio rebalanced on measured results |
| Customer and service | Journey maps, service metrics | Channels built team by team | Priority journeys measured end to end | Journeys redesigned from usage evidence |
| Operating model | Decision rights, team charters | Work handed between silos | Stable cross-functional teams for key products | Teams and funding shift with demand |
| Data | Data catalog, quality reports | Data rekeyed between systems | Named owners, quality measured in key domains | Data reused across products with tracked quality |
| Technology | Architecture map, deployment records | Point systems, manual releases | Shared platforms and APIs in priority areas | Frequent, low-risk change with automated controls |
| People | Skills inventory, training records | Skills sit with a few individuals | Role-based skills plans in priority areas | Skills plans updated from delivery evidence |
| Governance and risk | Risk register, control tests | Risk reviewed after launch | Controls built into delivery gates | Controls monitored continuously and fed back |
Level 5 is not the goal for every dimension. Set a target level per dimension based on strategy, risk and cost, then focus on the gaps that matter.
How to run the assessment with the right participants
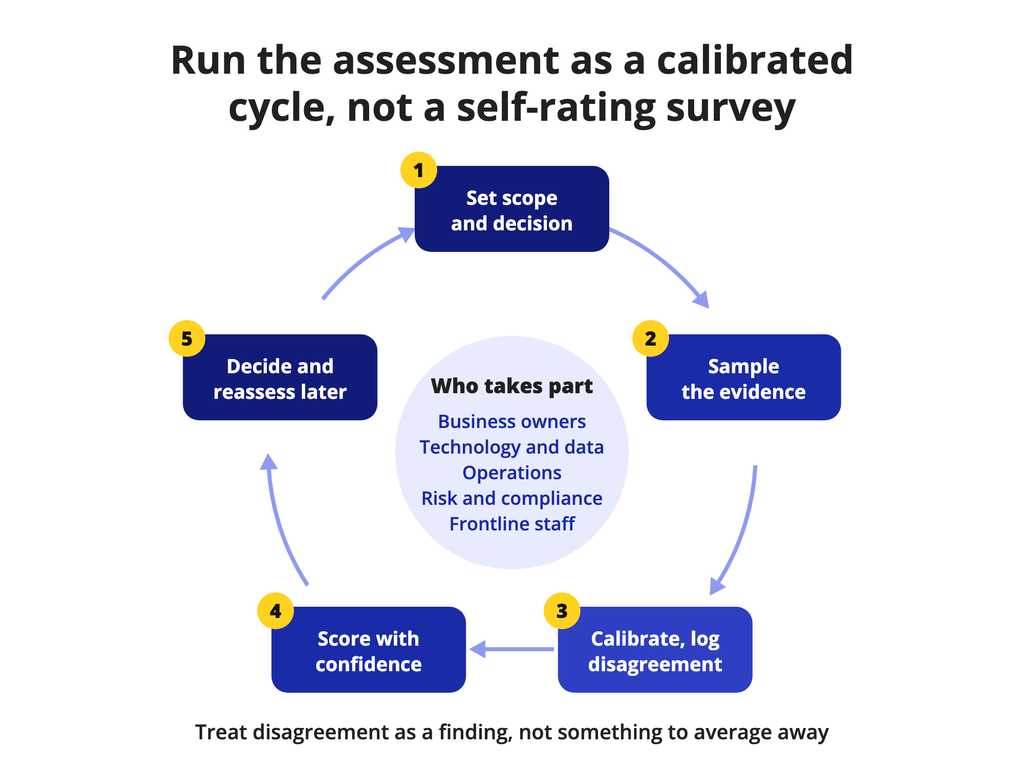
Decide the scope before anyone scores. Write down the business units, the time window the evidence covers and the decision the results will inform, such as next year’s investment plan. Without a decision, the assessment becomes a report nobody uses.
Invite five groups:
- Business owners, who know where value is won and lost.
- Technology and data teams, who know the real state of systems.
- Operations, who run the processes day to day.
- Risk and compliance, who see control gaps.
- Frontline staff, who see the workarounds that never reach a slide.
Collect evidence by sampling. Pick two or three journeys or products per dimension and verify artifacts, rather than asking every team to self-report. Then run a calibration workshop where groups compare ratings against the evidence.
Record disagreement instead of averaging it away. If business owners rate data at level 3 and the data team rates it at level 1, that gap is a finding in itself. Note both views, the evidence each side cited and the confidence level.
Fix the timing too. The EU tool measures before a support intervention and again about one year later, so the change between assessments can be linked to something that happened [4]. Copy the principle: tie each assessment to a baseline and a defined period of work.
How to turn a digital transformation maturity assessment into a roadmap
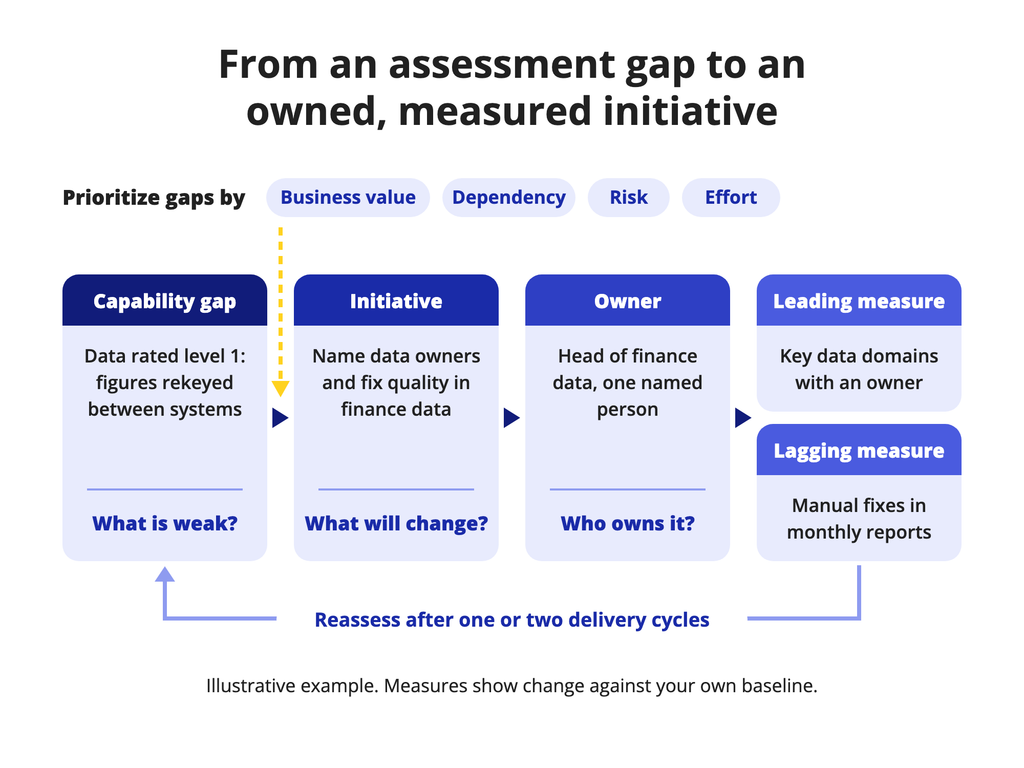
Scores do not fund anything. Translate each gap into an initiative, an owner and a measure.
Prioritize gaps on four tests:
- Business value: what improves if the gap closes, and for whom?
- Dependency: does another initiative need this capability first? Data ownership usually comes before advanced analytics.
- Risk: does the gap expose the organization to control, security or resilience failures?
- Effort: how much time, money and attention does closing it take?
For each priority, name one accountable owner and two measures. A leading measure shows the capability is changing, such as the share of key data domains with a named owner. A lagging measure shows the outcome, such as fewer manual corrections in monthly reporting.
Expect constraints. Budget cycles, legacy contracts, skills shortages and change fatigue slow most programs. Our guide to digital transformation challenges covers those constraints in detail. Build them into sequencing rather than discovering them mid-year.
Reassess only when meaningful change can be evidenced, usually after one or two delivery cycles. In the EU data, firms with lower starting scores improved more between assessments, and longer gaps between assessments were linked to larger increases [1]. Scores move with time and starting point, so judge progress against your own baseline, not against another organization.
Frameworks, limitations and common pitfalls
Published frameworks are useful references when you know what each one was built for.
| Framework | Owner | Scope | Scale |
|---|---|---|---|
| Digital Maturity Assessment | European Commission (JRC, EDIH network) | SMEs and public sector bodies, six dimensions | Score out of 100, overall and by dimension |
| Digital Maturity Assessment | KPMG | Eight connected-enterprise capabilities | Survey report benchmarked to KPMG’s best-practice view |
| Digital transformation maturity model | Prosci | People, process, technology and culture | Five stages, initial to optimized |
| CMMI | ISACA (CMMI Institute) | Process capability | Levels 0 to 5, incomplete to optimizing |
| Cybersecurity Framework 2.0 Tiers | NIST | Cybersecurity risk governance only | Four Tiers, partial to adaptive |
| DMAS and DMQS | ISO | National standards bodies | Maturity scores feeding a roadmap |
Use CMMI when your question is process discipline [6]. Use the NIST CSF 2.0 Tiers only for cybersecurity capability. NIST says progression to higher Tiers is encouraged when risks or mandates are greater or when a cost-benefit analysis supports it [7]. That logic applies to any dimension. ISO‘s models show how an assessment can feed a roadmap directly [8].
Watch for three pitfalls:
- Score inflation: self-ratings drift up when scores feel like performance reviews. Require evidence cards and calibration.
- Benchmark misuse: comparing your score to a vendor’s industry average assumes shared definitions you cannot check.
- False precision: a 3.4 average across eight dimensions hides the one gap that matters. Report levels with confidence, not decimals.
Summary
A digital transformation maturity assessment is a structured conversation about capability, backed by evidence. Define the reference model, collect evidence for every rating, allow “not assessed” and confidence, and turn gaps into owned initiatives with measures. Your next step: pick three dimensions tied to next year’s investment decisions and run an evidence-based assessment on them first. Remember that the rubric here is editorial and unvalidated; adapt it to your context.
FAQs
What is a digital maturity assessment?
It is a structured review of how capable an organization is today across dimensions such as strategy, data, technology, people and governance, rated against a stated model. A good assessment uses evidence, not only opinion, and records confidence. It differs from an audit, which tests compliance with fixed requirements, and from a vendor score, which uses the vendor’s own definitions and benchmarks.
What are the five levels of a maturity model?
Levels vary by model. CMMI uses levels from incomplete and initial to optimizing, while NIST CSF 2.0 uses four Tiers rather than five [6][7]. This article uses an illustrative editorial scale: ad hoc, emerging, defined, measured and adaptive. Each level describes observable behavior, and “not assessed” is allowed when evidence is missing. Always check which model a score refers to.
How do you use maturity assessment results?
Translate each priority gap into an initiative with one accountable owner, a leading measure and a lagging outcome measure. Rank initiatives by business value, dependency, risk and effort, then fund a short list. Share results as levels with confidence, not as a ranking. Reassess after one or two delivery cycles, when you can show evidence that the capability changed.
References
- European Digital Innovation Hubs Network’s activities and customers (State of play report 2024), EUR 40272. European Commission, Joint Research Centre, 2025. Accessed 28 Oct 2026.
- KPMG Digital Maturity Assessment. KPMG LLP, 2023 (page undated). Accessed 28 Oct 2026.
- Commission unveils new tool to help SMEs self-assess their digital maturity. European Commission, 30 Jul 2024. Accessed 28 Oct 2026.
- DMAT: Frequently Asked Questions. European Digital Innovation Hubs Network, European Commission, updated 30 Jul 2024. Accessed 28 Oct 2026.
- Digital Transformation Maturity Model: A Complete Guide. Prosci, updated 7 Aug 2026. Accessed 28 Oct 2026.
- CMMI Levels of Capability and Performance. CMMI Institute (ISACA), 2025. Accessed 28 Oct 2026.
- The NIST Cybersecurity Framework (CSF) 2.0, NIST CSWP 29. National Institute of Standards and Technology, 26 Feb 2024. Accessed 28 Oct 2026.
- ISO Digital Capability Maturity Assessment Models. International Organization for Standardization, undated. Accessed 28 Oct 2026.